Ahh, Data Is Beautiful (20 Charts)
I think one of the most satisfying things in the world is a well-made chart. There’s something about being able to convey interesting data is such an efficient way that is absolutely fascinating. It also makes me really happy these people are out there and not everyone is as dumb as me.
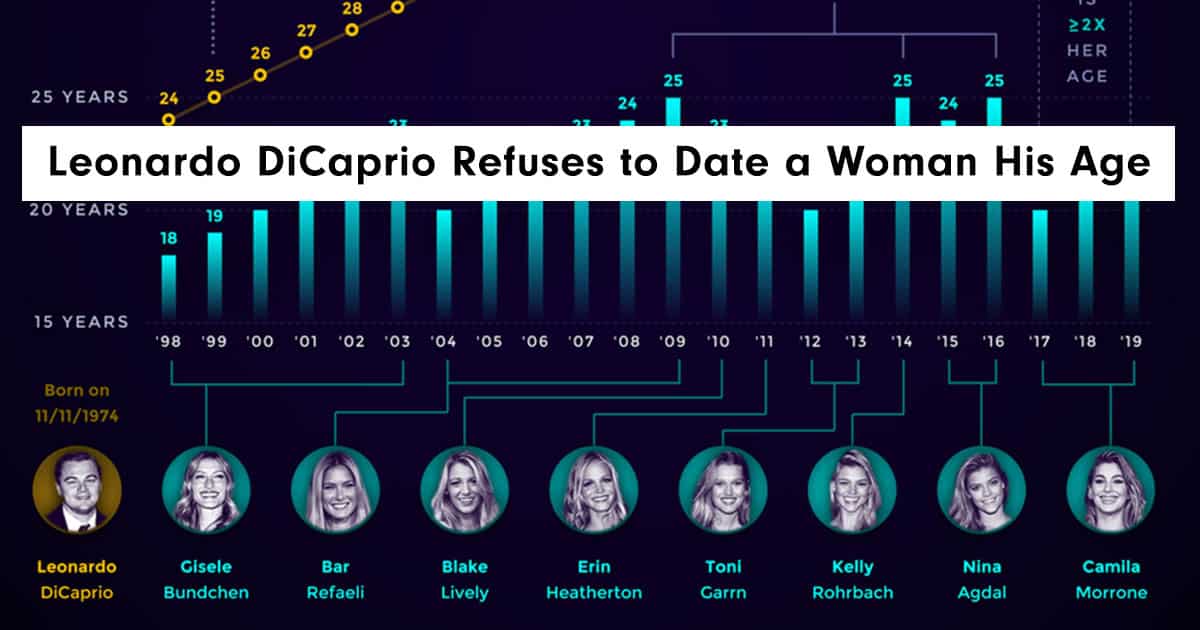
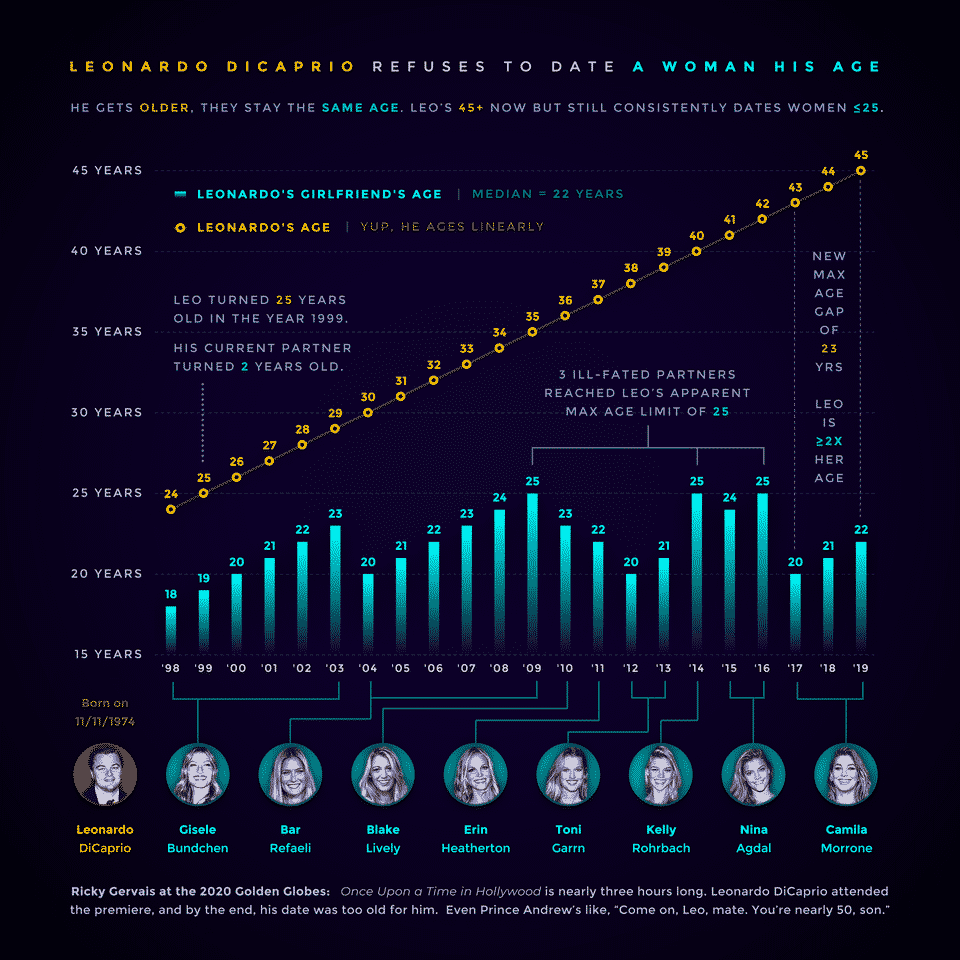
1. Leonardo DiCaprio Refuses to Date a Woman His Age
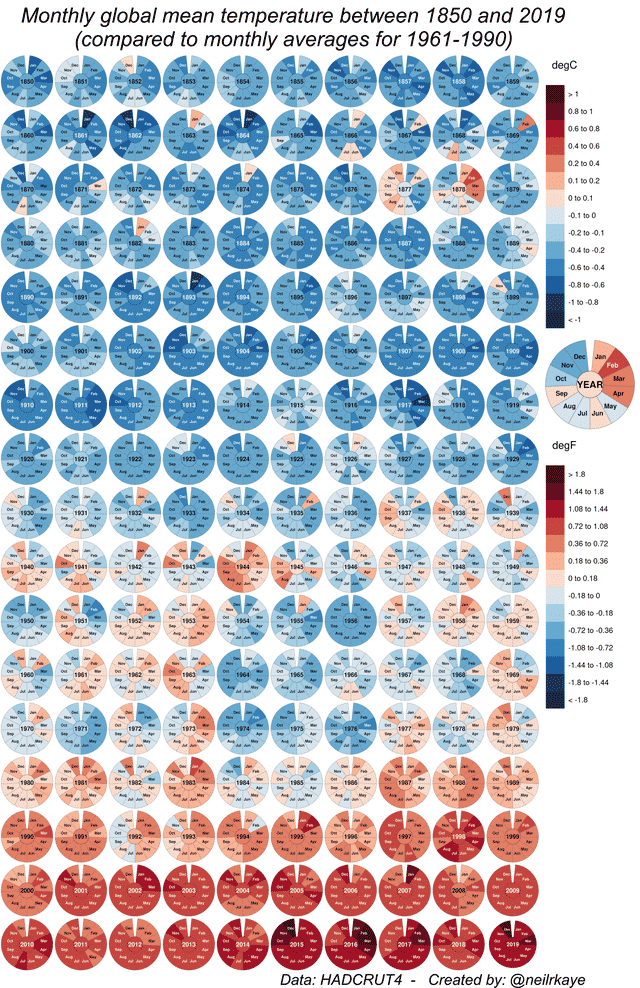
2. Monthly global temperature between 1850 and 2019 (compared to 1961-1990 average monthly temperature). It has been more than 25 years since a month has been cooler than normal.
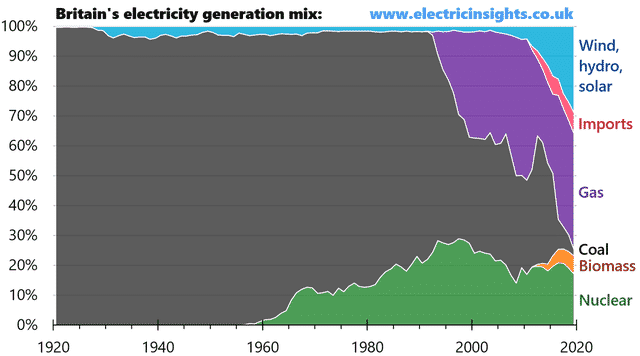
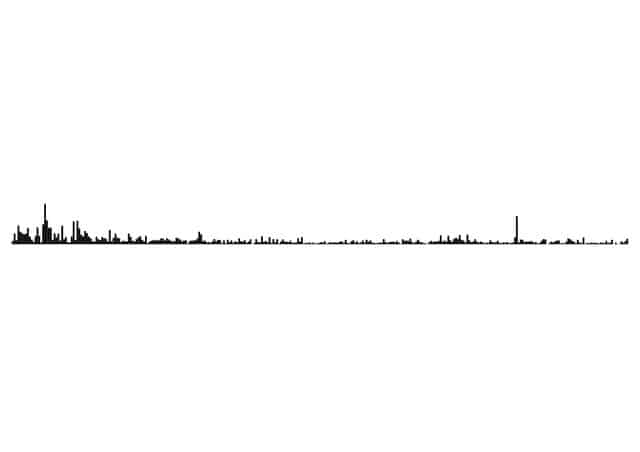
3. Britain’s electricity generation mix over the last 100 years.
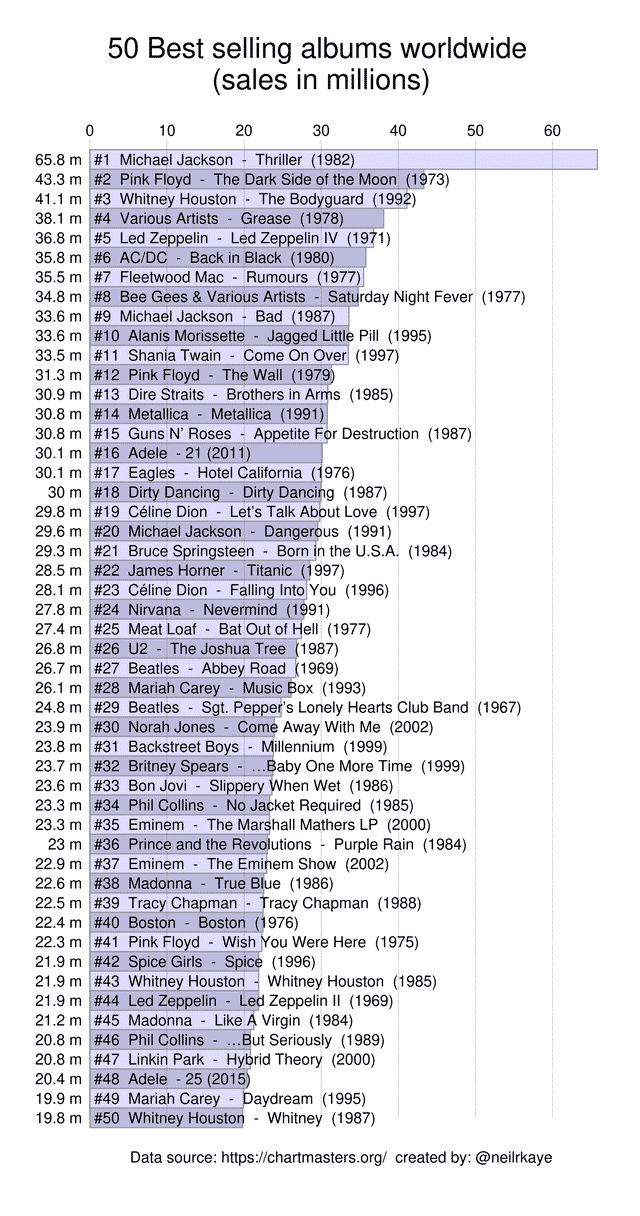
4. 50 best selling albums worldwide.
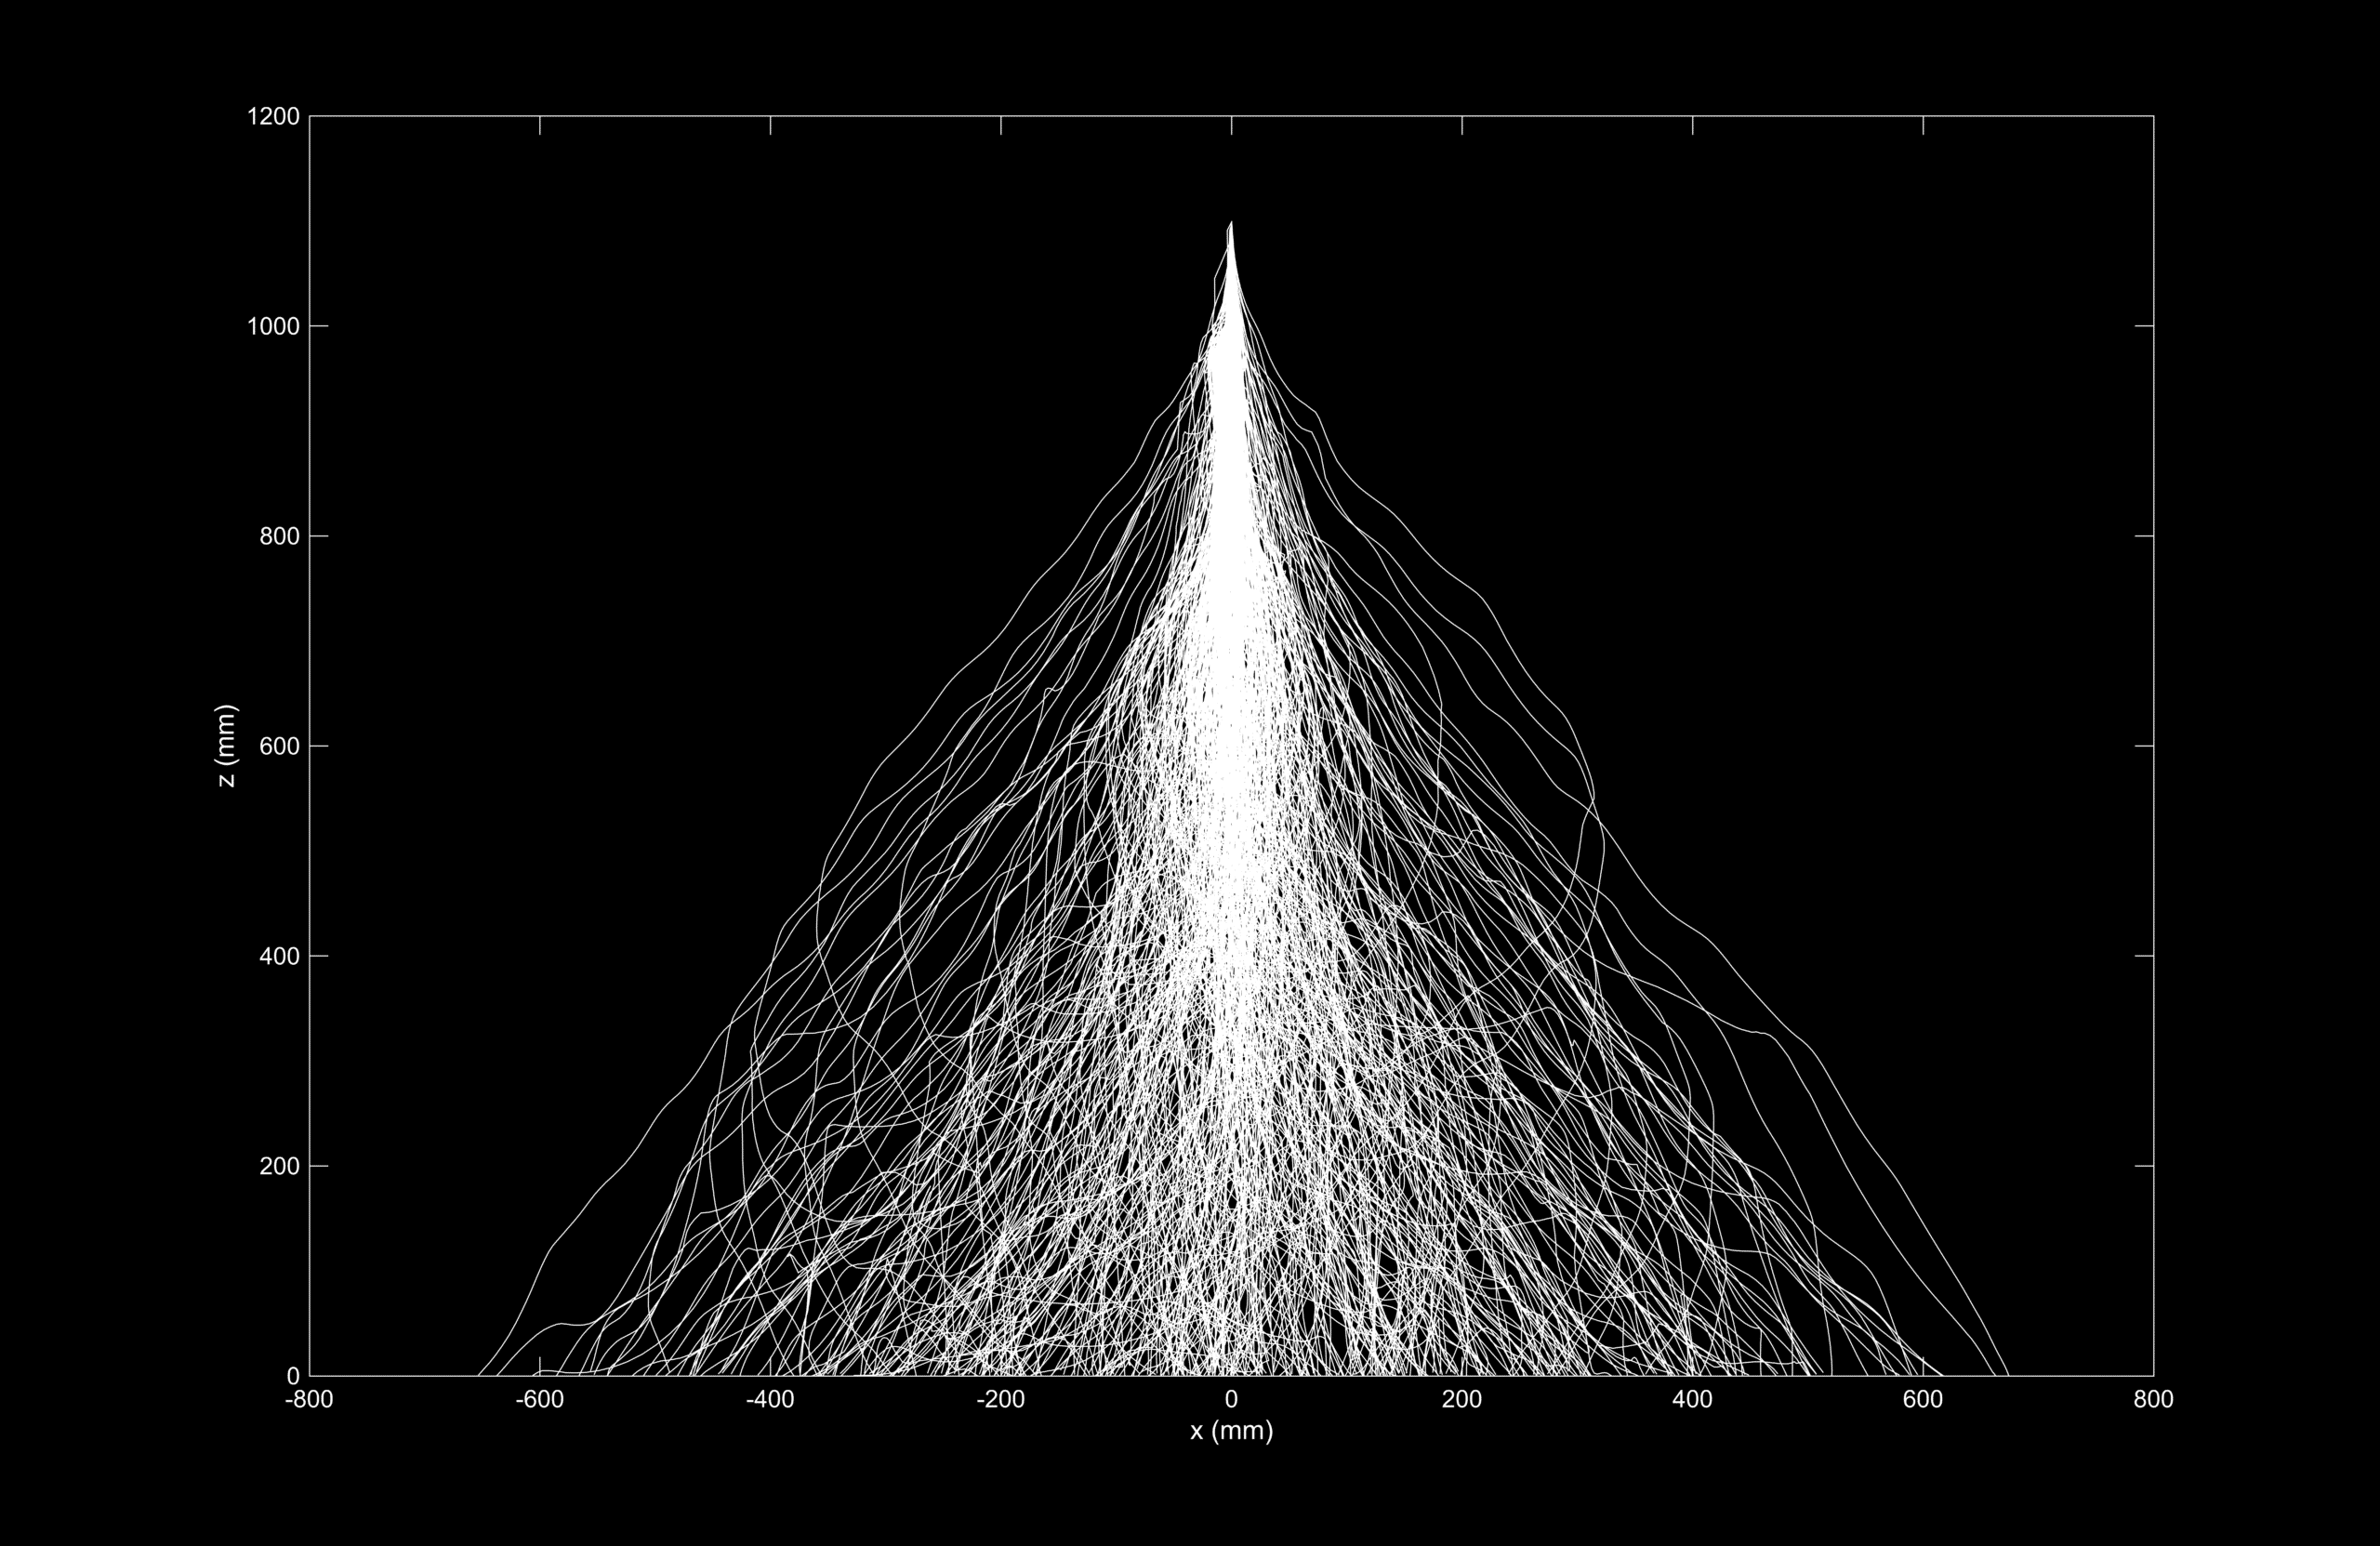
5. Trajectories of 400+ different paper shapes dropped from the same point.
6.
2 years of photosynthesis, as seen from space [OC] from r/dataisbeautiful
7.
[OC] The Earth seen from geostationary orbit at 4 um in the IR. I processed over 200 GB of data to make this video. from r/dataisbeautiful
8. Daily messaging frequency with my gf looks like NY (almost a year)
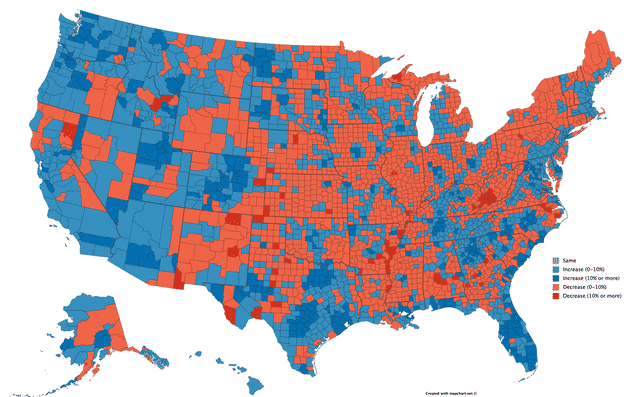
9. Percent population change in the US from 2010 to 2018 by county.
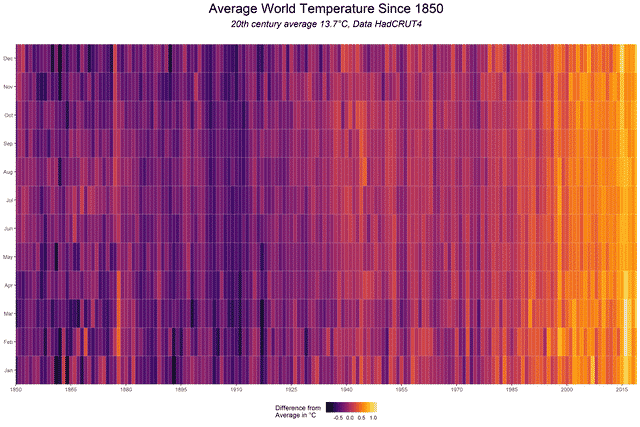
10. Average World Temperature since 1850.
Pages: 1 2