This Map Of “Each State’s Least Favorite Thanksgiving Food” Is Causing Some Debate (15 Pics)
Hello, I’m Matt Shirley and I make a new chart every day (or at least I try to.)
While that may not seem like a huge accomplishment, I assure you coming up with an original idea consistently is no easy feat. Plus, then I have to illustrate them. All while trying not to get distracted by the Internet.
A few years ago I started an Instagram account with the goal of creating a chart every day. I started out sketching charts on a dry erase board, but soon evolved to digital charts. Now I am commissioned to make charts for cash money. And I even have a Patreon, ahem if you want to check it out.
Anyway…
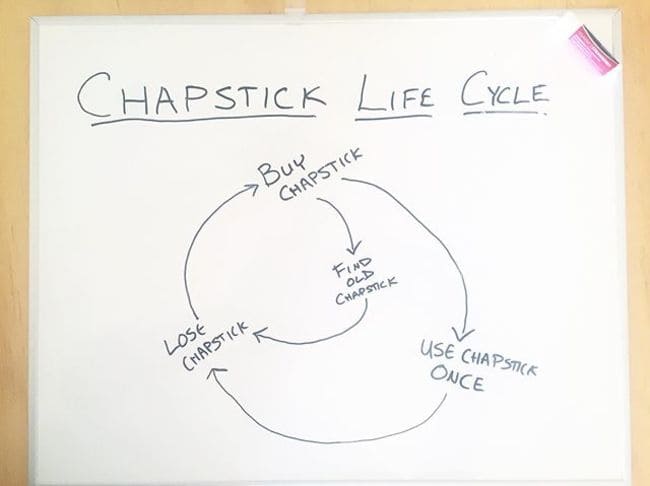
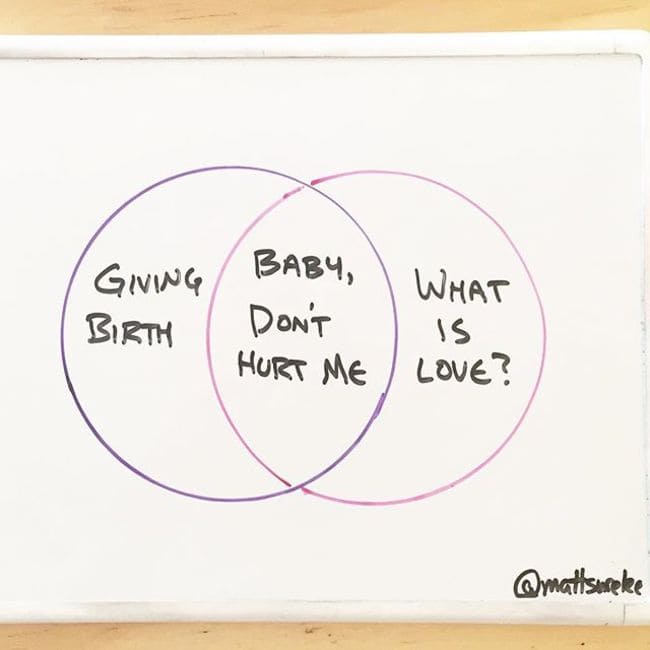
Here’s the chart that started it all:
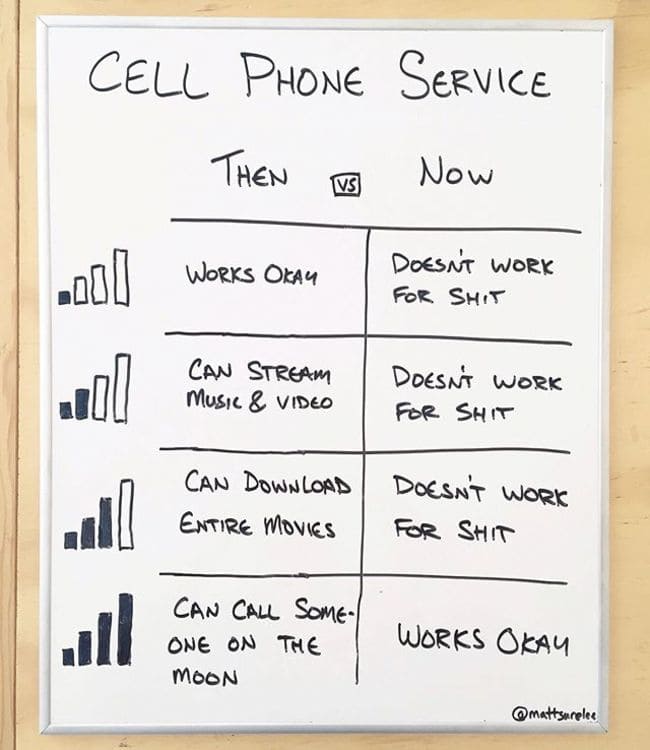
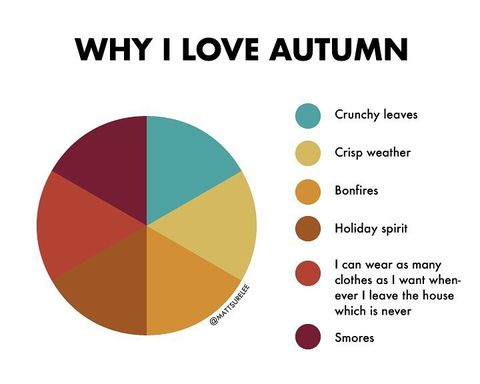
And a few of my favorites…
God, I love a good Venn:
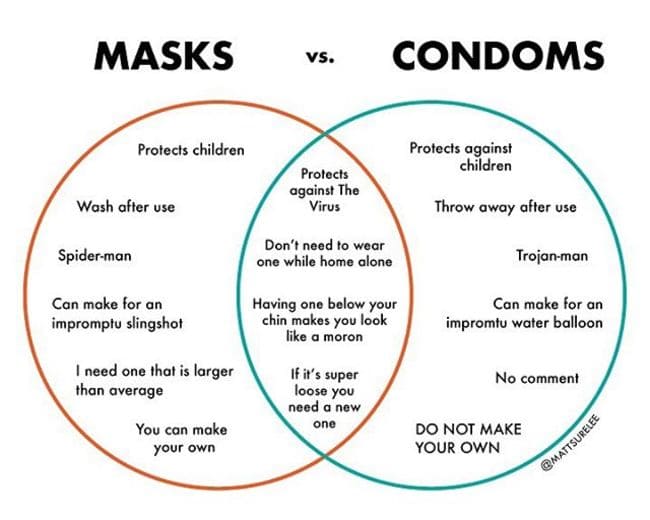
Venn, Venn, Venn…
They can look a little more professional when digital, but I like both TBH.
As my following has grown, I’ve been able to crowdsource data to make charts more accurate.
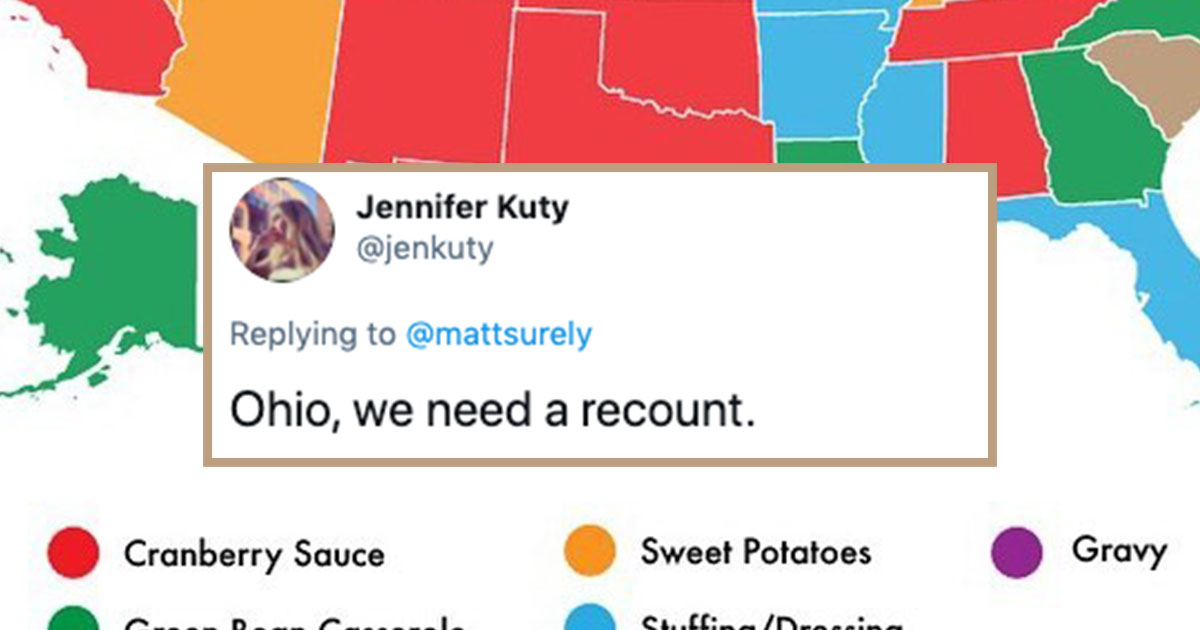
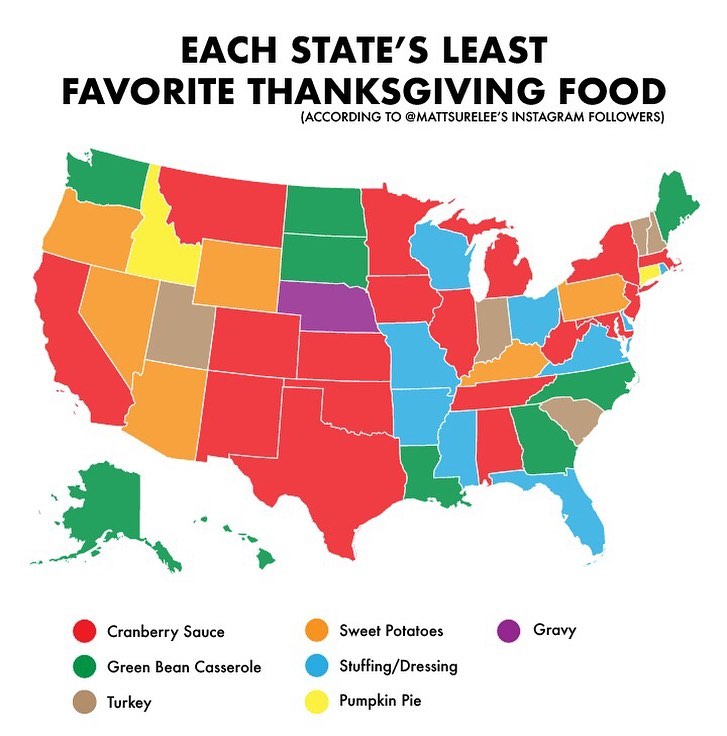
One of my favorite recent examples is the one where I asked people from each state what their least favorite Thanksgiving food was.
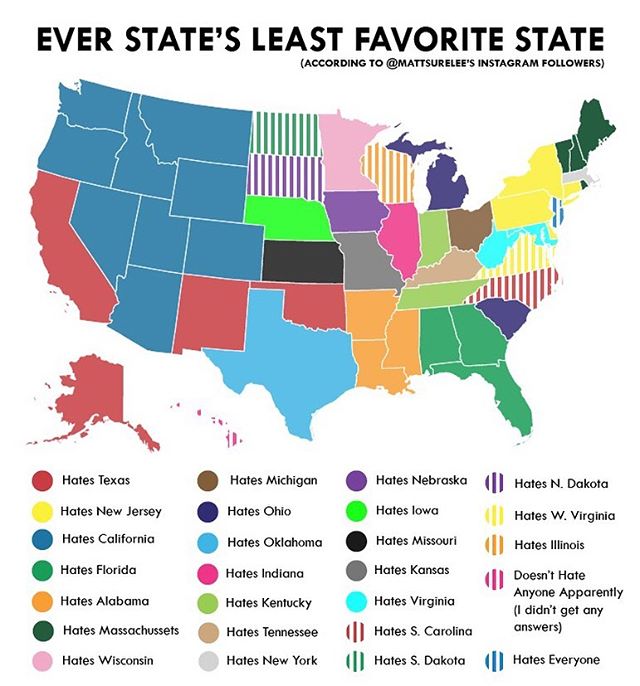
Now, this isn’t my first rodeo when it comes to the highly divisive state map polling. First, I did every state’s “least favorite other state…”
And then just “The Worst Thing About Every State…”
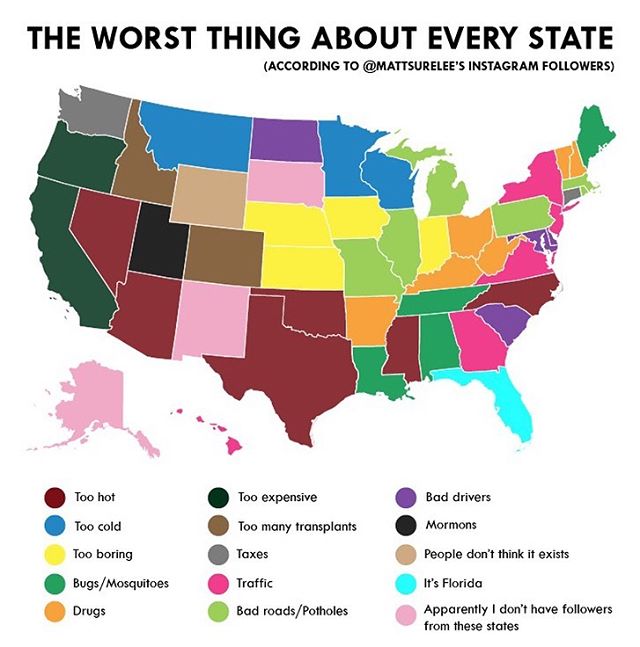
Unsurprisingly this map was met with equal outrage and praise…
Here’s what some of my Twitter followers were saying:
https://twitter.com/patrick20434430/status/1331040332465762304
https://twitter.com/hellocldwrld/status/1330984224476708864
To those that hate gravy… pic.twitter.com/bPKs7J5Eyl
— AggieDave 🇺🇸 (@AggieDave) November 23, 2020
In any event, feel free to weigh in yourself by following me on IG or Twitter. And Happy Thanksgiving!